Why Did This Visitor Leave After 3 Seconds?
A visitor lands on your website and leaves within seconds. Learn what a short session can tell you, what it cannot, and how to investigate the real cause.

Quantalog
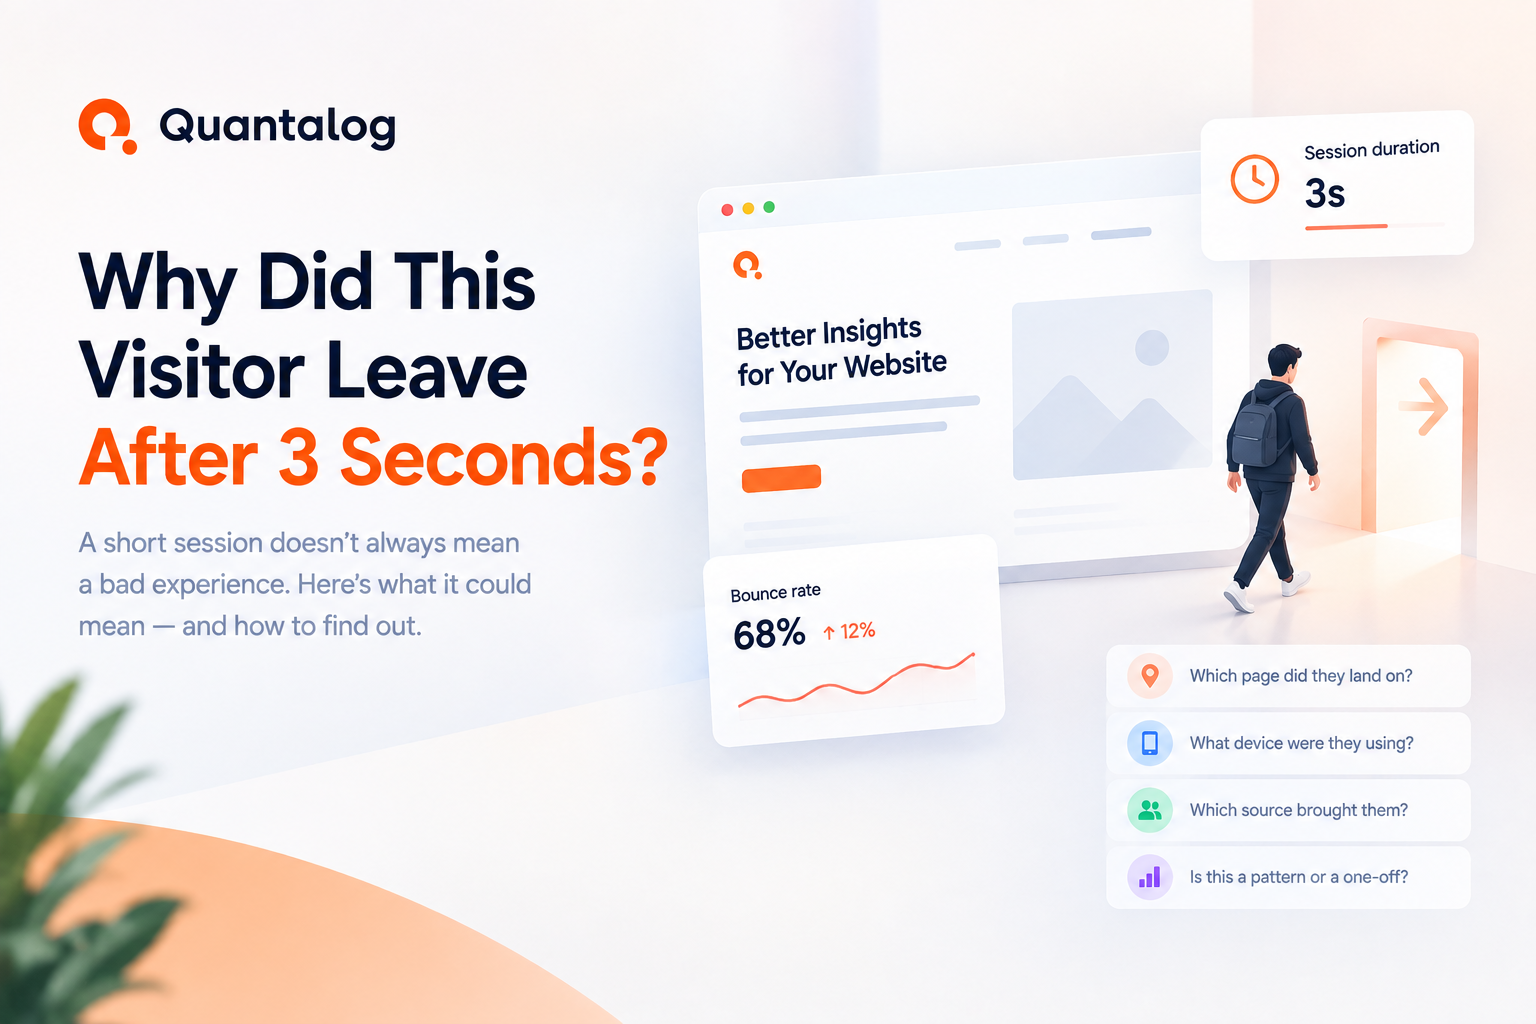
Someone visited your website.
They landed on your homepage.
And three seconds later, they were gone.
No button click. No signup. No form submission.
Just… gone.
And the frustrating part?
Your analytics probably tells you that they left — but not enough about what happened before they disappeared.
That three-second visit might look insignificant.
But when the same pattern happens again and again, it can reveal something important about your website.
The real question isn't:
"Why is my bounce rate high?"
It's:
"What happened during those three seconds?"
A 3-Second Visit Doesn't Tell You Much by Itself
One visitor leaving after three seconds isn't necessarily a problem.
They might have:
Found the information they needed
Clicked the wrong link
Realized they were on the wrong website
Been browsing casually
Left because the page didn't match their expectations
The interesting part is when you start seeing a pattern.
For example:
Landing Page | Visitors | Short Sessions |
|---|---|---|
Homepage | 1,240 | 31% |
Pricing | 420 | 8% |
Features | 680 | 12% |
Blog | 1,850 | 19% |
Now there's something worth investigating.
Why is the homepage losing so many visitors almost immediately?
That's where the right analytics data becomes useful.
What Happens During Those 3 Seconds?
When someone lands on your website, they're making a very quick decision:
"Am I in the right place?"
They're looking at the headline.
The page layout.
The loading experience.
The offer.
The navigation.
And most importantly:
Does this page match what I expected when I clicked?
If the answer isn't obvious, they may leave.
For example, someone searches for:
"privacy-friendly website analytics"
They click your website.
But the landing page starts with:
"The world's most powerful business intelligence platform."
That's not necessarily a bad headline.
But it doesn't immediately confirm that the visitor found what they were looking for.
Three seconds later:
Back button.
This Is Where Quantalog Helps
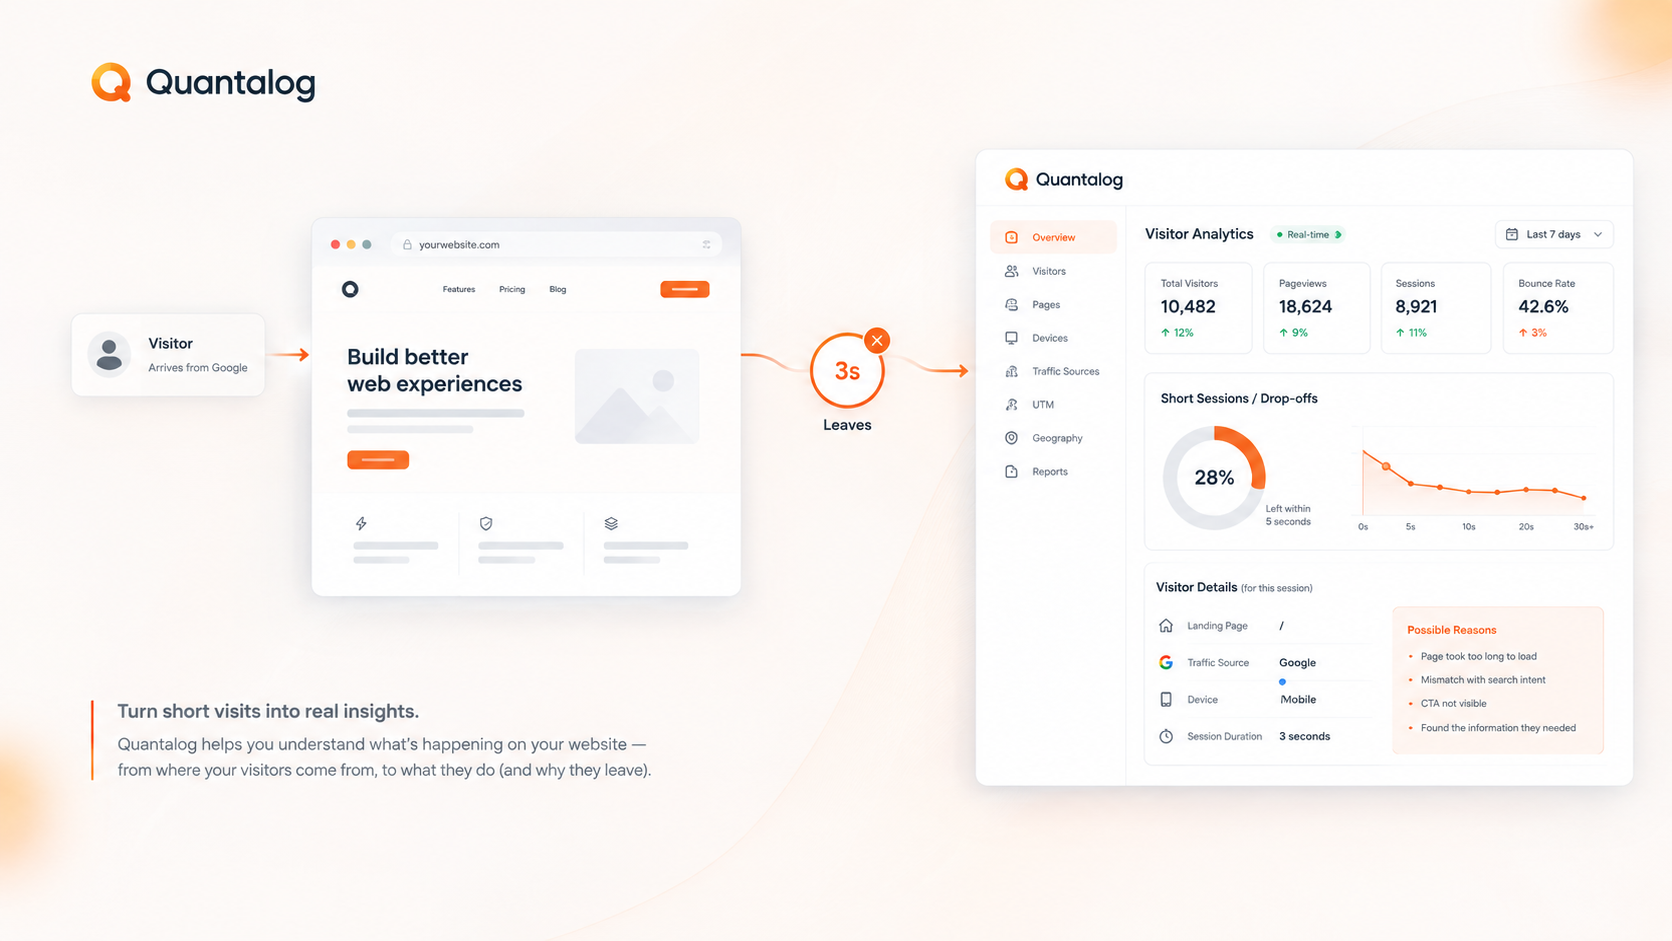
Instead of looking at your website traffic as one giant number, Quantalog helps you break that traffic down into actual visitor behavior.
You can see things like:
Where visitors came from
Understand whether a visitor arrived through Google, LinkedIn, a campaign, or another UTM-tagged source.
Which page they landed on
A three-second session on your homepage means something different from a three-second session on a blog article.
How long the session lasted
Short sessions can be identified and compared instead of disappearing inside an average session duration.
Which device they used
If mobile visitors are leaving much faster than desktop visitors, that's a useful signal to investigate.
Where visitors are coming from geographically
Country-level data can reveal whether certain audiences behave differently on your site.
What happened across the session
Instead of treating every visit as simply "visitor arrived → visitor left," Quantalog gives you more context around the session.
That context helps turn:
"Someone left after 3 seconds."
into:
"Most of these short sessions are coming from mobile visitors arriving from a particular campaign and landing on the homepage."
That's a much more useful problem to solve.
From a Guess to a Hypothesis
Let's say you're seeing lots of three-second sessions.
With Quantalog, you might discover:
Landing page: Homepage
Device: Mobile
Traffic source: Google
UTM campaign:summer-launch
Session duration: 2–5 seconds
Now you have something you can investigate.
Maybe the campaign promise doesn't match the homepage.
Maybe the mobile experience needs work.
Maybe the page is taking too long to become useful.
Maybe the traffic itself isn't relevant.
You still have to determine the cause.
But now you're investigating based on evidence instead of randomly changing your website.
Look Beyond the Bounce Rate
Bounce rate is useful as a high-level metric.
But by itself, it doesn't explain much.
Imagine two visitors:
Visitor A
Lands on your blog → reads for 90 seconds → gets the answer → leaves.
Visitor B
Lands on your homepage → stays for 3 seconds → leaves.
Both can contribute to a "single-page session."
But their behavior is obviously different.
That's why Quantalog's session and visitor-level context can be more useful than looking at one number in isolation.
The goal isn't to make every visitor stay longer.
The goal is to understand what visitors are actually doing.
Find Patterns Across Your Traffic
This becomes even more useful when you compare segments.
For example:
Desktop
2,400 visitors Average session: 1m 48s
Mobile
3,700 visitors Average session: 34s
That's a signal.
Or perhaps:
Short sessions: 18%
Short sessions: 7%
Another signal.
Or:
Homepage
Short sessions: 29%
Pricing
Short sessions: 6%
Another one.
Quantalog gives you the analytics data needed to make these comparisons across your website traffic.
Instead of asking:
"Is my website performing badly?"
you can ask much more specific questions:
Which visitors?
From where?
On which page?
Using which device?
From which campaign?
That's where the investigation starts getting useful.
What Should You Do After Finding the Problem?
Don't immediately redesign everything.
Start with the evidence.
If mobile visitors are leaving quickly:
Check the mobile experience.
If visitors from a specific campaign leave immediately:
Check whether the landing page matches the campaign.
If one page has an unusually high number of short sessions:
Review that page's headline, content, performance, and CTA.
If a particular traffic source behaves differently:
Look at the intent behind that traffic.
Then make a change.
And measure again.
That's the important loop:
Measure → Find a pattern → Investigate → Change → Measure again.
Your Analytics Should Answer More Than "How Many?"
Website analytics shouldn't stop at:
10,000 visitors this month.
That's a useful number.
But the more interesting questions are:
Where did they come from?
What pages did they visit?
Which devices did they use?
Which campaigns brought them in?
How long did they stay?
Where did they leave?
Which visitors actually engaged?
Quantalog is built around giving you this kind of context without turning analytics into a complicated enterprise dashboard.
Add the Quantalog script to your website, start collecting analytics, and use the data to understand what your visitors are actually doing.
So… Why Did That Visitor Leave After 3 Seconds?
Maybe the website was slow.
Maybe the visitor clicked the wrong result.
Maybe your headline didn't match their expectation.
Maybe your CTA wasn't obvious.
Maybe they found exactly what they needed.
Or maybe something completely different happened.
Analytics won't always give you the answer immediately.
But it can give you the clues.
And that's what matters.
Because instead of staring at:
"3-second session."
you can start asking:
"Who was this visitor, where did they come from, what page did they land on, what device were they using, and what happened before they left?"
That's the difference between simply counting traffic and actually understanding it.
Quantalog helps you make that investigation easier.
Your visitors are already telling you something.
You just need the right data to listen.
Try Quantalog on your own site
One script tag, no cookies, live numbers in about three seconds. Free forever on the Hobby plan.
Start freeKeep reading
Your Website Got 10,000 Visitors. So Why Did Nobody Buy?
Getting thousands of website visitors but no customers? Learn why traffic doesn't always lead to sales and how to identify where visitors drop off.
A Visitor Came From ChatGPT. Then This Happened.
A visitor clicked your website from ChatGPT. What happens next? Learn how ChatGPT referral traffic works, what analytics can reveal, and why AI traffic matters.