Deployment Intelligence: Turning Every Deployment Into an Observable Event
Learn how deployment intelligence connects deployments with website analytics, performance, errors, and user behavior to understand the real impact of every release.

Quantalog
6 min read
A deployment is usually treated as a single moment:
Code is merged → CI runs → deployment succeeds → release is live.
But that is only the beginning.
Once a new version reaches production, real users start interacting with it. Pages load. APIs respond. Errors appear. Traffic changes. Performance shifts. Search engines crawl the new version. And sometimes, something that looked perfectly healthy during deployment starts behaving differently in production.
This creates an important gap in modern development workflows:
We know when a deployment happened, but do we know what happened because of it?
That is where Deployment Intelligence comes in.
Instead of treating deployments as isolated CI/CD events, deployment intelligence connects a release with the behavior of the website after that release.
What Is Deployment Intelligence?
Deployment intelligence is the practice of connecting deployment information with the data generated by your application after a release.
A deployment can tell you:
when a release happened
which version was deployed
which branch was released
who triggered the deployment
whether the deployment succeeded or failed
But deployment intelligence goes further.
It helps answer questions such as:
Did traffic change after the deployment?
Did page performance improve or degrade?
Did error rates increase?
Did a specific page become slower?
Did API failures increase?
Did the deployment affect conversions or important user actions?
Did search visibility change after the release?
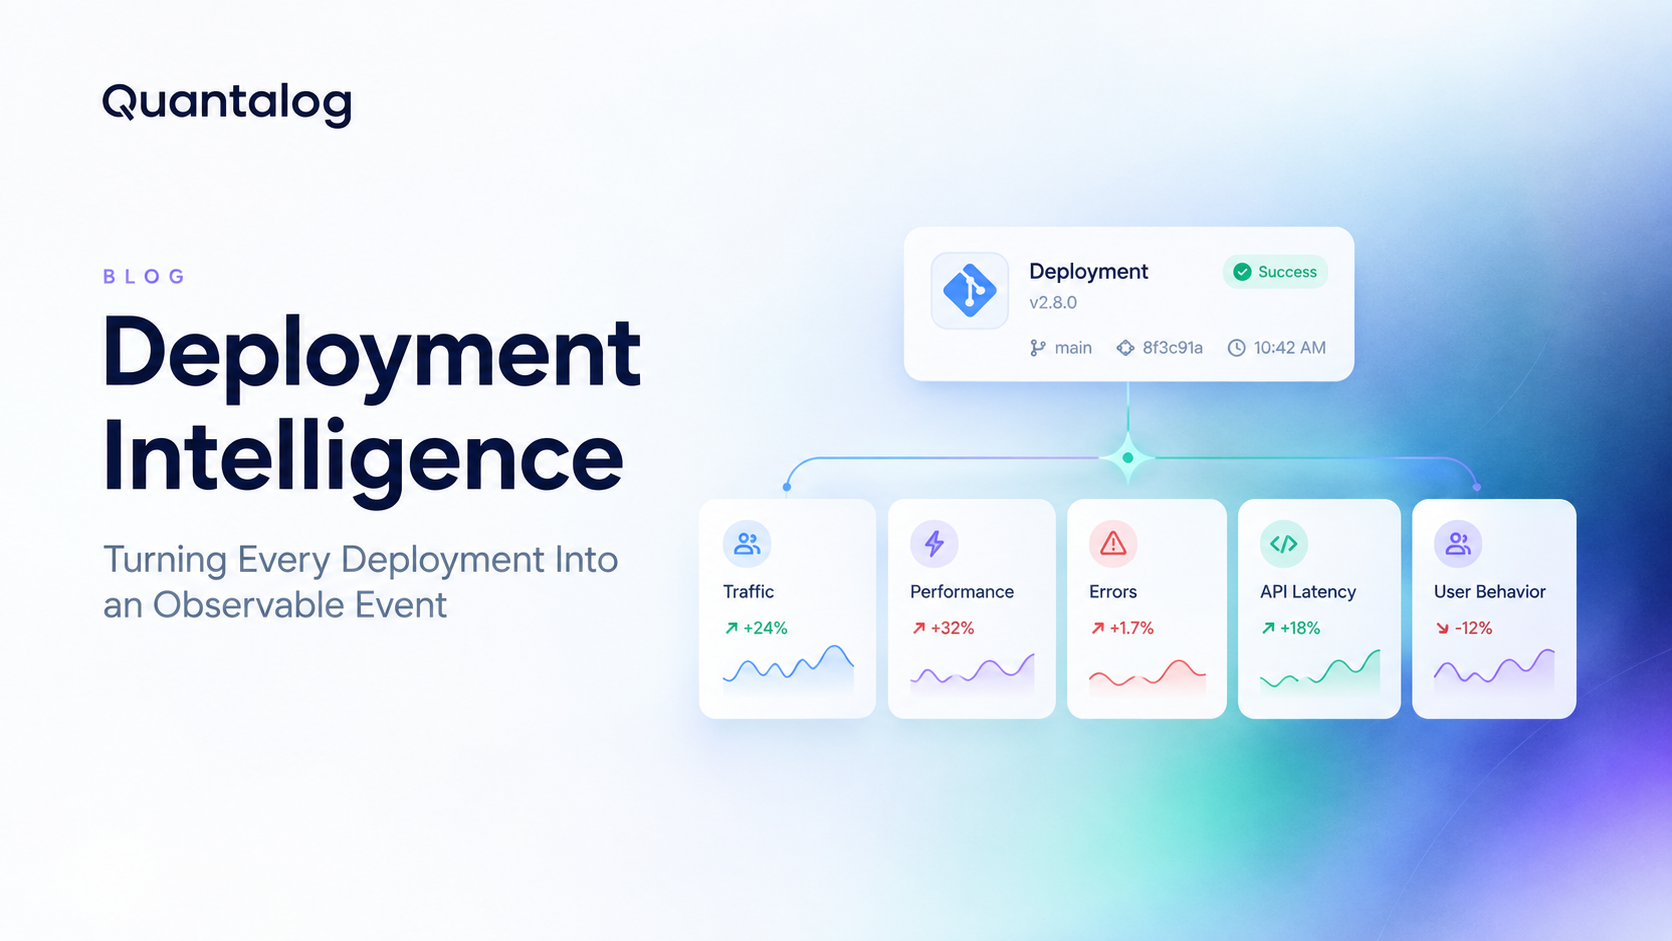
Instead of looking at these systems separately, deployment intelligence creates a timeline that connects them.
Deployment → Release → Website behavior → Outcome
That relationship is what makes deployments observable.
Why Deployment Status Alone Isn't Enough
Most development teams already have deployment information somewhere.
You might use GitHub Actions, GitLab CI, Jenkins, Vercel, AWS, Google Cloud, Firebase, or another deployment platform.
These tools are excellent at answering:
"Did my deployment work?"
But production monitoring needs to answer a different question:
"What happened after it worked?"
Imagine a deployment completed successfully at 10:42 AM.
The deployment system reports:
Deployment successful.
Everything looks fine.
But between 10:45 and 11:00 AM:
average page load time increases
JavaScript errors appear on one route
API response times increase
users start abandoning the page
Technically, the deployment succeeded.
From a product perspective, however, something changed.
Without connecting the deployment to your analytics and observability data, these events may look unrelated.
Every Deployment Is a Point in Your Product's Timeline
Think of your website as a continuously changing system.
Your users generate activity over time.
Your application generates events over time.
Your deployments also happen over time.
If these timelines are kept separately, understanding cause and effect becomes difficult.
But if deployments become observable events, you can create a timeline like this:
10:30 AM ── Previous version running
10:42 AM ── Deployment v2.8.0
10:45 AM ── Traffic increases
10:47 AM ── API latency increases
10:50 AM ── Error rate increases
10:55 AM ── Page engagement decreases
11:05 AM ── Rollback
11:10 AM ── Metrics return to normal
Now the deployment is no longer just a timestamp.
It becomes context.
That context can make troubleshooting significantly easier.
The Connection Between Deployments and Analytics
Traditional website analytics tells you what users are doing.
Deployment systems tell you what your engineering team changed.
These datasets become much more useful when they are connected.
For example:
Deployment | Before Release | After Release |
|---|---|---|
| 1.8s page load | 2.6s |
| 0.4% error rate | 1.7% |
| 62% engagement | 55% |
| Normal API latency | Increased latency |
The important insight isn't simply that the numbers changed.
The important part is knowing when the change happened relative to the deployment.
That gives developers a much stronger starting point for investigation.
What Should a Deployment Event Contain?
A useful deployment event doesn't need to contain everything about your CI/CD pipeline.
It needs enough context to identify the release and connect it with production behavior.
A deployment event could include:
Version
The application version, release number, commit SHA, or deployment identifier.
Environment
For example:
Production
Staging
Preview
Timestamp
The exact time the deployment became active.
Source
The branch, repository, or commit that produced the deployment.
Author
The person or automation process that triggered the release.
Status
For example:
Successful
Failed
Rolled back
Deployment provider
The platform responsible for the deployment.
Once this information exists alongside analytics, deployments become useful reference points instead of isolated records.
Deployment Intelligence Isn't Just About Failures
One of the biggest misconceptions is that deployment monitoring is primarily about finding broken releases.
That's only one use case.
Deployment intelligence can also help identify successful changes that produced unexpected behavior.
For example:
A deployment might successfully introduce a new checkout experience.
There are no errors.
The deployment is healthy.
But after release, completed checkouts decrease.
Nothing technically failed.
Something changed.
This is where combining deployment data with product analytics becomes valuable.
A deployment can act as a marker for investigating changes in:
traffic
engagement
conversions
performance
errors
API behavior
user journeys
From Deployment Monitoring to Deployment Intelligence
There is an important difference between monitoring deployments and understanding deployments.
Deployment monitoring
Usually asks:
"Is the deployment healthy?"
Deployment intelligence
Asks:
"What changed after the deployment?"
The first is operational.
The second is analytical.
Deployment intelligence brings together information from different parts of the development and production lifecycle so teams can understand the impact of releases.
A Practical Deployment Intelligence Workflow
A simple implementation can follow four stages.
1. Capture the deployment
When a production deployment happens, record the event.
For example:
Deployment: v2.8.0
Environment: production
Commit: 8f3c91a
Time: 10:42 AM
Status: successful
2. Place it on the analytics timeline
Treat the deployment as an event in your analytics system.
Now developers can see where releases happened relative to other events.
3. Compare before and after
Look at relevant metrics around the deployment.
For example:
30 minutes before
        ↓
Deployment
        ↓
30 minutes after
Depending on the application, useful metrics could include:
page views
active users
bounce rate
page performance
errors
API latency
conversions
4. Investigate anomalies
If something changes significantly after a deployment, the deployment becomes a useful investigation point.
This doesn't automatically prove that the deployment caused the change.
It simply gives the team a strong temporal relationship to investigate.
That distinction matters.
Why Developers Need This Context
Developers already work with many tools.
One tool shows commits.
Another shows deployments.
Another shows logs.
Another shows errors.
Another shows analytics.
Another shows performance.
The problem isn't necessarily a lack of data.
It is often the lack of connection between the data.
Deployment intelligence is about reducing that context switching.
Instead of asking:
"When did we deploy?"
then:
"What happened around that time?"
you can start with a timeline where the deployment is already part of the context.
The Future of Deployment Observability
As applications become increasingly automated, the number of deployments continues to increase.
Teams may deploy:
multiple times per day
dozens of times per day
automatically after a merge
through preview environments
through feature flags and progressive rollouts
At that scale, manually remembering what changed becomes increasingly difficult.
Deployment events therefore become another important layer of application observability.
The future isn't just about knowing whether software was deployed successfully.
It's about understanding how each release interacts with the system around it.
How Quantalog Fits Into Deployment Intelligence
This is where website analytics can evolve beyond traditional traffic reporting.
Quantalog can use deployment events as another layer of context around website behavior.
Instead of looking at analytics as a collection of isolated charts, deployment intelligence can help connect:
Releases → Traffic → Performance → Errors → User behavior
That makes it easier to investigate what changed around a particular release and understand the production impact of engineering decisions.
The goal isn't to replace your existing CI/CD platform.
Your deployment platform should continue doing what it does best: building and shipping software.
Analytics should provide the context around what happens next.
Deployment Should Be an Event, Not Just a Status
A deployment shouldn't disappear from your workflow once the green checkmark appears.
That green check tells you that the release was delivered.
It doesn't tell you what happened afterward.
By turning deployments into observable events, development teams can connect engineering activity with real production behavior.
And that creates a more complete feedback loop:
Build
  ↓
Deploy
  ↓
Observe
  ↓
Analyze
  ↓
Learn
  ↓
Improve
  ↓
Deploy again
That is the real value of deployment intelligence.
Every deployment becomes part of your application's history—and every release becomes an opportunity to learn from what happened next.
Explore Deployment Intelligence with Quantalog
If you're building and deploying modern web applications, your analytics should help you understand more than just who visited your website.
It should also help you understand what changed—and what happened after you changed it.
Explore Quantalog and bring deployments, analytics, and production behavior closer together.