From Google Impression to Customer: Measuring the Full Search Journey
A Google impression is only the beginning of the customer journey. Learn how to connect search impressions, clicks, website visits, engagement, and conversions to understand the real business value of organic search.
Quantalog
A potential customer can discover your business long before they ever visit your website.
They might see your page in Google Search.
Ignore it.
See it again a few days later.
Click it.
Read an article.
Come back through another search.
Sign up for your product.
And eventually become a customer.
If you're only measuring the final conversion, you're missing most of the journey.
And if you're only measuring impressions or clicks, you're missing the business outcome.
Modern SEO measurement needs to connect the entire path:
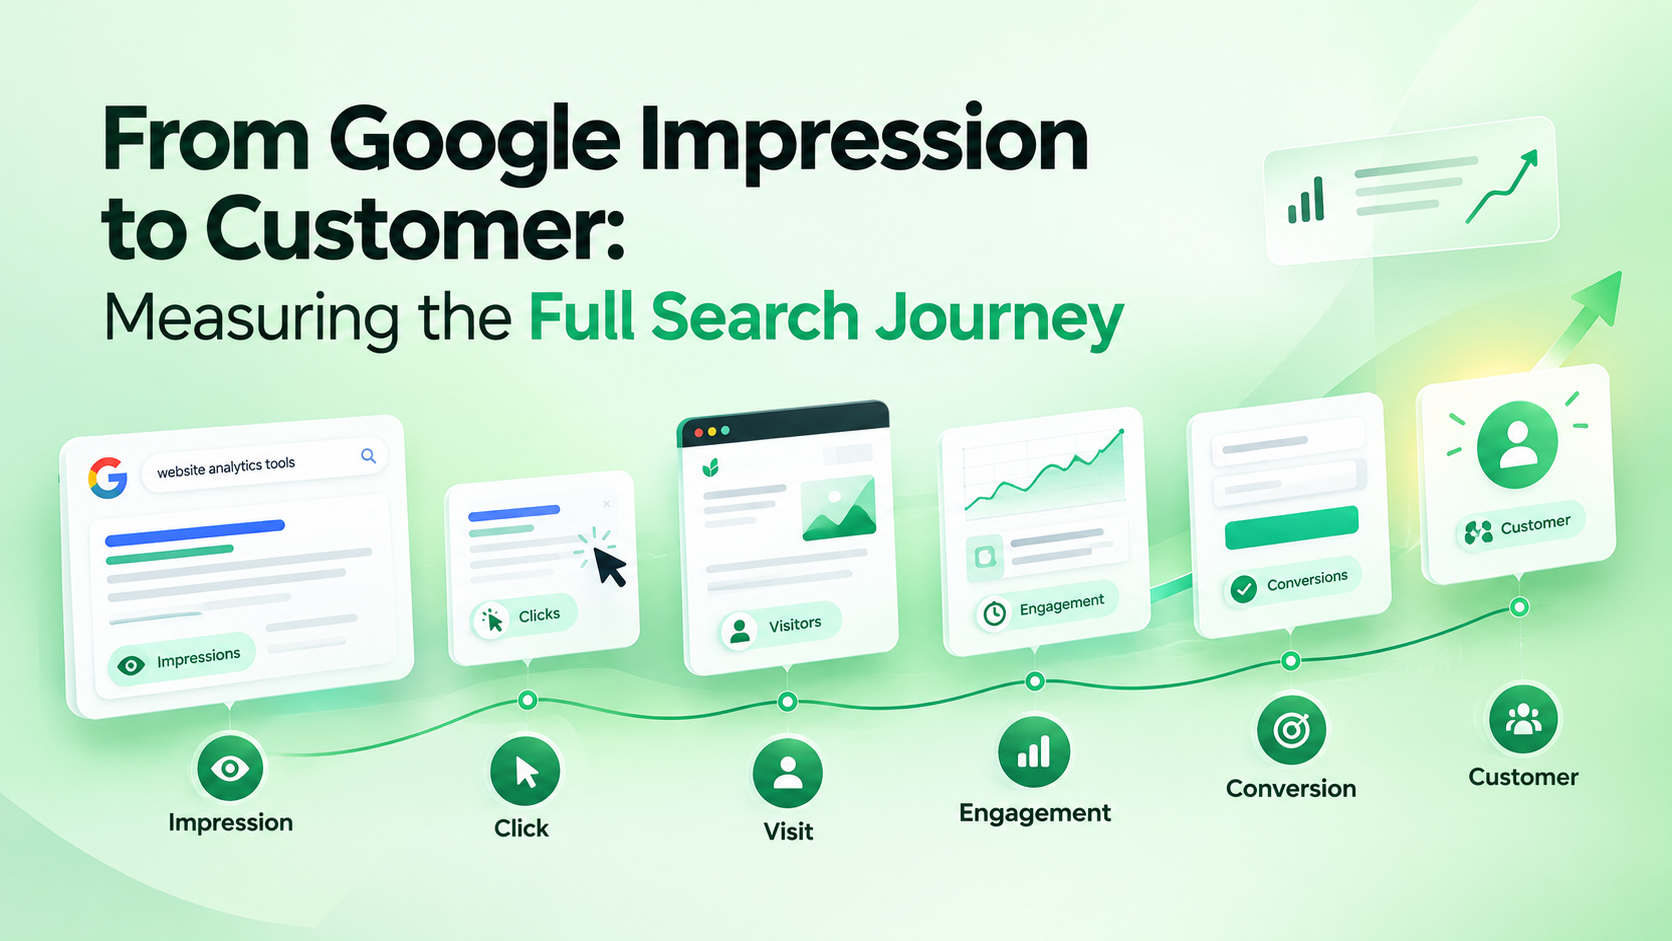
Impression → Click → Visit → Engagement → Conversion → Customer
This article explains how to think about that journey and why connecting search visibility with website analytics gives you a much clearer picture of organic performance.
The Search Journey Starts Before the Website Visit
Traditional website analytics often begins when someone reaches your website.
But organic search starts earlier.
Before someone visits your website, Google may already be showing your content to them.
That creates a sequence of events:
Google Search
↓
Impression
↓
Click
↓
Website Visit
↓
Engagement
↓
Conversion
↓
Customer
Every stage answers a different question.
Impression
Are people seeing your website in search?
Click
Are people choosing your result?
Visit
Are those clicks actually reaching your website?
Engagement
Are visitors finding your content useful?
Conversion
Are visitors taking the action you want?
Customer
Is organic search contributing to actual business growth?
Looking at all of these stages together is much more informative than looking at any single SEO metric.
Stage 1: Impressions — Are You Being Seen?
An impression occurs when your website's search result is displayed to a user in Google Search.
Imagine your page receives:
100,000 impressions
That tells you that Google is giving your content significant exposure.
But an impression doesn't mean someone visited your website.
It doesn't even mean they noticed your result.
It simply tells you that your result appeared within the search experience under Google's reporting rules.
This makes impressions primarily a visibility metric.
If impressions are increasing, your website may be gaining exposure for more queries or appearing more frequently for existing searches.
If impressions are falling, something may have changed in your search visibility.
Possible reasons include:
Ranking changes
Changes in search demand
Competitor growth
Search-result changes
Seasonal behavior
Content changes
Algorithmic changes
Impressions are therefore an important starting point—but they aren't the finish line.
Stage 2: Clicks — Are People Choosing You?
The next step is the click.
Suppose your page receives:
100,000 impressions
and
5,000 clicks
Your search result generated a 5% click-through rate.
Now you know that some people who saw your result decided to visit it.
This is where CTR becomes useful.
A low CTR can sometimes indicate that your result isn't compelling enough for the query.
Potential factors include:
Search intent mismatch
Weak or unclear title
Unclear value proposition
Strong competing results
SERP features taking attention
Brand familiarity
Query type
However, CTR should always be interpreted alongside ranking position and search intent.
A page ranking in position 9 and a page ranking in position 1 shouldn't be evaluated against exactly the same expectations.
Stage 3: Website Visits — Did the Click Become a Visit?
The next stage is where Search Console and website analytics meet.
A search click doesn't necessarily equal a recorded website session.
As discussed in our previous article, differences can occur because of:
Tracking implementation
Consent settings
Browser privacy controls
Ad blockers
Page-load timing
Reporting differences
Different metric definitions
So rather than expecting the numbers to match perfectly, use them to understand different parts of the journey.
Search Console helps answer:
How did people discover and click your website from Google?
Analytics helps answer:
What happened after they arrived?
That distinction becomes extremely important as you move toward measuring business outcomes.
Stage 4: Engagement — Did the Visitor Find What They Needed?
Getting someone to your website isn't enough.
Imagine two pages both generate:
10,000 organic visits
Page A produces:
High engagement
Multiple page views
Product exploration
Signups
Returning visitors
Page B produces:
Very short visits
Few interactions
Almost no conversions
Both pages generated the same amount of traffic.
But their value to the business could be very different.
This is why organic traffic shouldn't be treated as the final SEO metric.
You need to understand what visitors do after they arrive.
Depending on your analytics setup, useful signals can include:
Engaged sessions
Engagement time
Page views
Pages per session
Returning users
CTA interactions
Form submissions
Product views
The right metrics depend on the purpose of your website.
Stage 5: Conversion — Did the Visitor Take Action?
Eventually, the search journey should connect to an action.
For one website, that might be:
Newsletter signup
For another:
Demo request
For an ecommerce store:
Purchase
For a SaaS product:
Free account creation
A conversion gives you a much stronger signal than traffic alone.
For example:
20,000 organic visits
sounds impressive.
But consider:
20,000 visits → 40 signups
versus:
8,000 visits → 240 signups
The second page or traffic segment may be generating fewer visitors but significantly more conversions.
This is why traffic volume and traffic value aren't the same thing.
Stage 6: Customer — Where SEO Creates Business Value
The final stage is the one businesses ultimately care about.
A conversion doesn't always equal a customer.
Someone may:
Download an ebook
Join a newsletter
Start a free trial
Request a demo
Create an account
before eventually becoming a paying customer.
That means the real journey can be even longer:
Impression
↓
Click
↓
Visit
↓
Engagement
↓
Lead
↓
Trial
↓
Customer
SEO can influence several stages of that process.
The challenge is determining which search queries and landing pages contribute to meaningful outcomes.
One Keyword Can Have a Much Bigger Journey Than You Think
Consider a hypothetical SaaS company targeting the search query:
"website analytics software"
A user sees the company's article in Google.
Day 1
Impression
The article appears in search.
Day 3
Click
The user clicks the article and reads it.
Day 7
Return visit
The same person searches for the company again.
Day 10
Product page
They explore the product.
Day 12
Signup
They create a free account.
Day 25
Conversion
They become a paying customer.
If you only looked at the original search click, you'd see:
1 organic click
But the business outcome was much larger.
This is why SEO measurement becomes more useful when search data and website analytics are connected.
The Four Numbers You Shouldn't Analyze in Isolation
A simple SEO report might show:
Metric | Result |
|---|---|
Impressions | 100,000 |
Clicks | 5,000 |
Visits | 4,500 |
Conversions | 180 |
Each number tells part of the story.
But the relationships between them tell you much more.
Impression → Click
Measures how effectively search visibility turns into clicks.
Click → Visit
Helps identify differences between search activity and recorded website traffic.
Visit → Conversion
Shows how effectively organic visitors take valuable actions.
Together, these relationships help you identify where the biggest opportunities exist.
Where Is Your Biggest Drop-Off?
Imagine your organic search funnel looks like this:
200,000 impressions
↓
10,000 clicks
↓
8,500 visits
↓
2,000 engaged visitors
↓
250 leads
↓
40 customers
Now ask:
Where is the biggest opportunity?
It could be improving search-result CTR.
It could be improving landing-page engagement.
It could be improving conversion rates.
Or it could be attracting more qualified searches.
Without the full funnel, it's easy to focus on the wrong problem.
High Impressions + Low Clicks
This usually means you have visibility but aren't getting enough clicks.
Investigate:
Search intent
Ranking positions
Titles
Meta descriptions
SERP competition
Search-result features
A page may already have an opportunity to generate more traffic without needing to dramatically increase impressions.
High Clicks + Low Engagement
Now the problem may be after the search result.
Potential causes include:
Content doesn't match search intent
Slow page experience
Weak landing-page experience
Misleading title
Poor mobile experience
Visitors aren't finding the information they expected
The solution may not be more SEO.
It may be improving the page itself.
High Traffic + Low Conversions
This is another common situation.
Your SEO strategy may be successfully generating visitors, but the traffic may not be commercially valuable.
Investigate:
Search intent
Landing pages
Calls to action
Conversion flow
Audience relevance
Product-market alignment
More traffic won't automatically solve a conversion problem.
Low Traffic + High Conversion Rate
This situation can be overlooked.
Imagine a page receives only:
1,000 organic visits
but converts at:
8%
That's 80 conversions.
Another page receives:
10,000 visits
but converts at:
0.2%
That's only 20 conversions.
The lower-traffic page may deserve more attention because it already demonstrates strong conversion potential.
This is why SEO strategy should consider quality and intent, not just traffic volume.
How to Connect Search Data With Analytics
A useful reporting workflow starts by bringing the datasets together.
Search data can tell you:
Which queries generate impressions
Which pages receive search clicks
Average position
CTR
Device performance
Country performance
Search visibility trends
Analytics can tell you:
Sessions
Users
Landing-page behavior
Engagement
Conversions
User journeys
Business outcomes
When you connect these datasets, you can ask much more useful questions.
For example:
Which search queries generate the most valuable visitors?
Which pages have high search visibility but low engagement?
Which pages receive strong traffic but weak conversions?
Which search opportunities could produce more business value?
These are much more actionable questions than:
"Did our organic traffic go up this month?"
Don't Optimize for Traffic Alone
It's tempting to celebrate whenever organic traffic increases.
But traffic is only one stage of the journey.
A better question is:
What happened because that traffic arrived?
If organic traffic increased by 30% but conversions stayed flat, you have a different problem than if both traffic and conversions increased.
Similarly, if traffic falls but qualified leads increase, the situation may not be as simple as the traffic number suggests.
The goal isn't necessarily to maximize every metric.
The goal is to understand how search visibility contributes to meaningful outcomes.
A Practical Search Journey Dashboard
If you're building a dashboard for organic performance, consider organizing it into five layers.
1. Visibility
Impressions
Search queries
Indexed pages
Average position
2. Discovery
Clicks
CTR
Landing pages
Search channels
3. Traffic
Users
Sessions
New vs returning visitors
Landing-page visits
4. Engagement
Engagement rate
Engagement time
Page views
Key interactions
5. Business
Leads
Signups
Purchases
Revenue
Customers
This structure turns a collection of SEO metrics into a search-to-business funnel.
Search Visibility Is the Beginning, Not the End
A page appearing in Google is valuable because it creates an opportunity.
But the real journey begins when someone decides whether to click.
Then they decide whether to stay.
Then whether to engage.
Then whether to take an action.
And eventually, whether to become a customer.
That means SEO performance shouldn't be reduced to:
"How many keywords do we rank for?"
or:
"How much organic traffic did we get?"
A better question is:
How does search visibility contribute to the customer journey?
Try Quantalog on your own site
One script tag, no cookies, live numbers in about three seconds. Free forever on the Hobby plan.
Start freeKeep reading
Search Clicks vs Website Visitors: Why These Numbers Never Match
Google Search Console clicks and website analytics visitors often show different numbers. Learn why they differ, what each metric actually measures, and how to use both to understand your website's search performance.
Your Pages Are Indexed but Still Getting No Traffic — Here's Why
Your page is indexed by Google but still gets little or no organic traffic? Learn why indexing doesn't guarantee visibility, rankings, clicks, or visitors—and how to identify what is holding your pages back.